Usability Study Results Overview
Using your prototypes
Understanding usability test results
Once you set up your usability study and there are some participants, the usability test dashboard summarizes the results for analysis.

The dashboard contains the following:
- Test analytics overview
- Task completion funnel & 1st-click report
- User segments & participation details
(a-1) Test analytics overview
It shows high-level analytics for all the tasks in your test, and aggregates the metrics across participants.

For each task you can see:
- Success rate (percentage computed by dividing # of participants who completed the task by total # of participants for that task)
- How many people completed it
- Average time required to complete the task
Clicking on a task card will show the participation details for each task.
(a-2) Task completion funnel & 1st-click report
The task completion funnel aggregates how participants used the expected success path. It displays an image for each step of the path, and how many participants completed the task in the expected sequence.

The completion funnel helps you analyze the following:
- Expected success path and completion rate: It shows the path that was set up when creating the usability task, and how many participants completed the task using that path (sequence of steps).
- Drop-off: Shows number of participants who navigated away from the expect path (participants are only counted once).
- 1st-click report: Interaction markers show whether the participant’s 1st interaction matched an expected interaction, shown as a blue circle marker. If not, you will see an unexpected interaction or mis-click, shown a red diamond.
(a-3) User segments & participation details
For most tasks, participants can complete it any way they want, not just following the expected path. The user segments report separates participants into groups (segments) based on how they completed the task.
The user segments are created automatically using the following criteria:
- Expected success path segment: It groups participants who successfully complete the task using the sequence of steps created when defining the task
- Alternative success path segment: It groups participants who used a path different from the expected path, but still completed the task (i.e., reach last step).
- Failed path segment: It groups participants who were either unable to complete the task or skipped it the task.
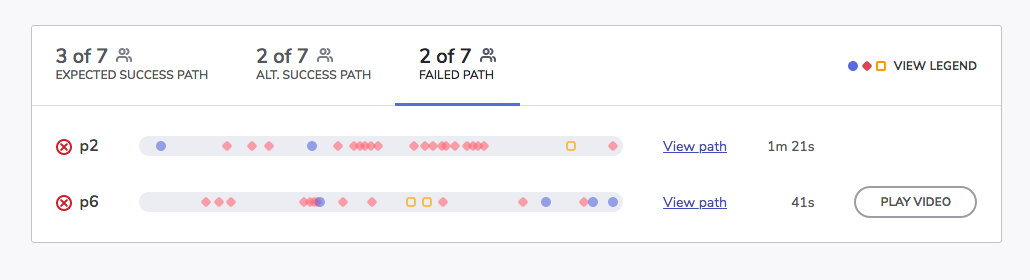
The participation details table show the session analytics for each participant and shows the following:
- Whether participant completed the task
- Click path for a participant, shown as a sequence of expected or unexpected interaction markers.
- Time on task metric
- View feedback button if the participant added feedback for that task
- "Play Video" option if a user video is available
(a-4) Explore click path
Hovering on the click path using your mouse shows a mini preview of the screen and where the user clicked.
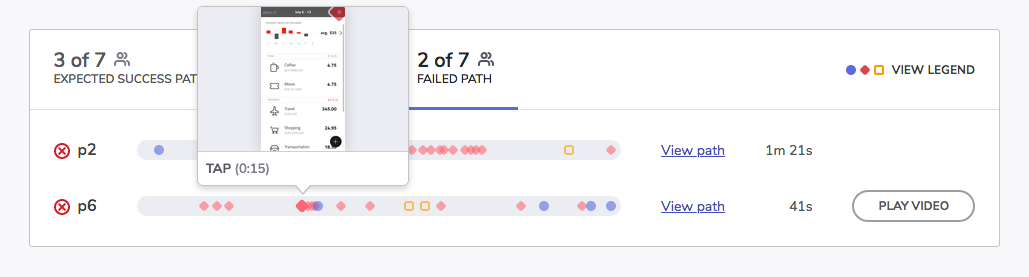
Clicking on the timeline marker in the details table launches the click-path explorer. This allows you to review all the steps taken by that participant.
If there are more than one interactions present, the numbering on the interaction markers show the sequence in which the participant interacted with the screen. Note that only the interactions related to the selected task is shown.

(a-5) Video replay of user sessions
You can view the session video by clicking on the "play video" option in the details table. You can also view the video while exploring the click-path by selecting the video tab.

The video timeline displays the same timeline of user interactions that's shown in the details table. You can jump directly to a portion of the video by clicking on the timeline marker.
And to download the video, right click on the video use the "save video as..." option from your browser’s context menu.
Learn more
Watch some of the videos we have on usability studies.